Monitoring APC AP7900 switched PDU with Prometheus and Grafana
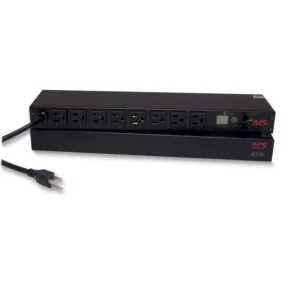
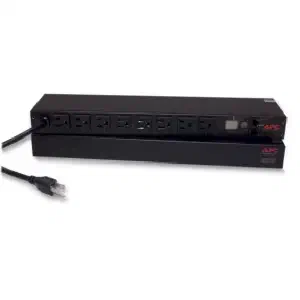
The APC AP7900 is a 1U single phase PDU with 8 switchable outlets and a network interface. It’s been EoL’d and can be had for less than 20% of it’s original price on eBay. The network interface is so underpowered tha it can’t support any modern cryptographic ciphers.
So with that, here’s a revised copy of my notes from the process of getting the device reset, updated and monitored.
The Hardware
Unfortunately, there’s no “reset everything to defaults” button or button sequence on the PDU. The unit I purchased had been configured with a manual IP assignment so it wasn’t as straightforward as using an unfolded paperclip to press the reboot button at boot and wait for a successful DHCP negotiation. This process has been covered before, so I’ll omit it here. In short: connect to the local mgmt interface via the serial port, adjust the network configuration and other settings as needed.
The firmware can be updated via FTP easily enough. The processor on the network interface is really slow so allow for several minutes between the bin file upload and the flashing to commence/end. I had to repeat this three times for each of the partitions / subsystem OSs.
The Metrics
Again, because the network interface has an ancient/slow CPU, any method that extracts metrics from the device must be light weight… enter SNMP.
SNMP is quite old and cumbersome but there’s an exporter for prometheus which, after some tedious configuration, can interface the complexity that is is legacy SNMP with prometheus.
Generating a config
In short, SNMP identifies each setting/entity that can be monitored or set with a unique numerical ID. Each number is separated with a . and represents a specific edge/vertex on the graph of all settings that device supports.
So, a setting known as rPDUIdentDeviceLinetoLineVoltage may be ‘read’ at the following address: 1.3.6.1.4.1.318.1.1.12.1.15.0. So if you have a few hundred parameters to monitor, you’ll have a few hundred nondescript numerical paths. Keeping track of them all is a royal pain in the ass, even with lookup tables; known as “MIB files”.
Unfortunately, there’s no way around it; a map between the numerical paths and the ‘human friendly’ names must be built so the prometheus exporter knows what to expose and how to categorize it.
The exporter comes with generator to make this process a bit easier, but the process of obtaining MIB files isn’t quite so straightforward.
I hit a few snags and below is an updated Dockerfile that gave me a working generator tool:
FROM golang:latest

##
# The `mibs` target in the Makefile does not run to completion on OSX.
# Somewhere, a `sed` command is run against some vendor's MIB file that's for hardware that I don't want to target.
# I don't have the patience to resolve those issues and i'd prefer that the _entire_ MIB parse and generate
#   process be 100% contained in the container image anyways.
#
# There are a _variety_ of errors that cropped up when running `generator parse_errors`:
#
# - level=warn ts=2020-12-27T21:40:42.988Z caller=main.go:120 msg="NetSNMP reported parse error(s)" errors=16924
# - Cannot find module (SNMPv2-SMI): At line 275 in mibs/apc-powernet-mib
# - Did not find 'enterprises' in module #-1 (mibs/apc-powernet-mib)
# - Did not find 'DisplayString' in module #-1 (mibs/apc-powernet-mib)
# - Unlinked OID in PowerNet-MIB: apc ::= { enterprises 318 }
# - Undefined identifier: enterprises near line 281 of mibs/apc-powernet-mib
# - Cannot adopt OID in PowerNet-MIB: atsInputEntry ::= { atsInputTable 1 }
# -   <and hundreds more `Cannot adopt OID in PowerNet-MIB:` messages
# - Bad operator (INTEGER): At line 73 in /usr/share/snmp/mibs/ietf/SNMPv2-PDU
#
#
# After some searching, it appears that MIBs can refer to other MIBs and some set of 'base' files is not present.
# Due to licensing, the Debian docker image that the generator is based on does NOT ship w/ them or the
#   `snmp-mibs-downloader` tool which is used to fetch the base MIB files. This is easy enough to fix...
##
# First, update the repos we'll pull packaged from
RUN echo "deb http://deb.debian.org/debian/ buster main contrib non-free" | tee -a /etc/apt/sources.list && \
    echo "deb http://deb.debian.org/debian/ buster-updates main contrib non-free" | tee -a /etc/apt/sources.list && \
    echo "deb http://security.debian.org/debian-security buster/updates main contrib non-free" | tee -a /etc/apt/sources.list

# Then we run the 'original' set of commands, adding in the `snmp-mibs-downloader` package.
# As part of the post-install hook, snmp-mibs-downloader will fetch the base MIBs that appear to be
#   missing.
##
RUN apt-get update && \
    apt-get install -y libsnmp-dev p7zip-full snmp-mibs-downloader && \
    go get github.com/prometheus/snmp_exporter/generator && \
    cd /go/src/github.com/prometheus/snmp_exporter/generator && \
    go get -v . && \
    go install

# To fix _this_ error:
#   Bad operator (INTEGER): At line 73 in /usr/share/snmp/mibs/ietf/SNMPv2-PDU
#
# we install a 'patched' version.
# src: https://serverfault.com/questions/936119/snmp-mibs-on-ubuntu-error-in-mibs
##
RUN wget http://pastebin.com/raw.php?i=p3QyuXzZ -O /usr/share/snmp/mibs/ietf/SNMPv2-PDU

##
# This command is not needed for generation, but IS needed for manual checking / use of `snmptranslate` within the
#   container. Add to the above RUN statement if needed.
#       sed -i "s/^\(mibs *:\).*/#\1/" /etc/snmp/snmp.conf
#
# It simply comments out the `mibs:` line in `/etc/snmp/snmp.conf`
##

# The 'stock' generator expects the output of `make mibs` to be mounted into /opt/mibs.
# Since we are no longer relying on the `make` target, we must tell the generator binary
#   to look in all of the 'system default' locations *as well as* /opt/mibs
##
WORKDIR "/opt"
ENTRYPOINT ["/go/bin/generator"]

# Rather than do something like this on the CLI every time the container is run
#   `-e MIBDIRS="/usr/share/snmp/mibs:/usr/share/snmp/mibs/iana:/usr/share/snmp/mibs/ietf:/opt/mibs"`
#   we do it here...
##
ENV MIBDIRS /usr/share/snmp/mibs:/usr/share/snmp/mibs/iana:/usr/share/snmp/mibs/ietf:/opt/mibs

CMD ["generate"]
In short, ditch the make mibs step from here and move it inside the docker build step; fetch all the MIB files, patching those that need it. Tell the tool where to find them.
For my needs, I only care about the total amount of power being distributed through the PDU so, of the hundreds of different parameters that can be monitored, I’m only interested in:
- Uptime
- Input Voltage
- Power in Watts and VoltAmps
- Percentage of used/remaining capacity
This makes for a simple generator config:
# See: https://github.com/prometheus/snmp_exporter/tree/master/generator
##

modules:
  # APC/Schneider UPS Network Management Cards
  #
  # Note: older management cards only support SNMP v1 (AP9606 and
  # AP9607, possibly others). Older versions of the firmware may only
  # support v1 as well. If you only have newer cards you can switch to
  # version v2c or v3.
  #
  # The management cards have relatively slow processors so don't poll
  # very often and give a generous timeout to prevent spurious
  # errors. Alternatively you can eliminate the interface polling (OIDs
  # beginning with 1.3.6.1.2.1) to reduce the time taken for polling.
  #
  # MIB: https://download.schneider-electric.com/files?p_File_Name=powernet426.mib
  # Guide: http://www.apc.com/salestools/ASTE-6Z5QEY/ASTE-6Z5QEY_R0_EN.pdf
  # Download site: http://www.apc.com/us/en/tools/download/index.cfm
  ##
  apcups:
    # Not 100% sure why, but APC firmware does not appear to properly authenticate with the
    #   credentials that i've set through the web UI. I've disabled write/set via SNMP so
    #   sticking w/ v2 (no auth) is fine.
    version: 2

    walk:
      # Don't care about network stats on this guy...
      # - interfaces
      ##
      # Do care about uptime, tho
      - sysUpTime

      ##
      # For reasons that I don't understand, specifying the OID results in errors like this:
      #   level=error caller=main.go:130 msg="Error generating config netsnmp" err="cannot find oid '.1.3.6.1.4.1.318.1.1.12.1.15.0' to walk"
      # But the path '.1.3.6.1.4.1.318.1.1.12.1.15.0' maps to rPDUIdentDeviceLinetoLineVoltage.0
      # So specify that by name and the error goes away :/
      ##
      - rPDUIdentDeviceLinetoLineVoltage # .1.3.6.1.4.1.318.1.1.12.1.15.0
      - rPDUIdentDevicePowerWatts        # .1.3.6.1.4.1.318.1.1.12.1.16.0
      - rPDUIdentDevicePowerVA           # .1.3.6.1.4.1.318.1.1.12.1.18.0
      - rPDULoadStatusTable              # .1.3.6.1.4.1.318.1.1.12.2.3.1

    ##
    # From `rPDULoadStatusTable`, I can get `rPDULoadStatusLoad` and `rPDULoadStatusLoadState`
    #    which represent the percentage capacity as a percentage and a "low, nominal, warn, critical" flag.
    #
    # Don't need to resort to the `lookup` mechanism as the PDU has only one bank and can just extract the values
    #   by referring to them explicitly below. This would likely change w/ a 2U PDU

    # Allows for adjustment to how various SNMP endpoints are parsed (as info about a device vs a moving metric)
    # See: https://github.com/prometheus/snmp_exporter/tree/master/generator#enumasinfo-and-enumasstateset
    ##
    overrides:
      # Should be a percentage of load
      rPDULoadStatusLoad:
        type: gauge
      # In addition to a numerical load percentage, also handy to have the characterization _of_ that load, too
      # In this case, the load can be characterized one of 4 ways:
      #   phaseLoadNormal (1),phaseLoadLow (2),phaseLoadNearOverload (3),phaseLoadOverload (4)
      rPDULoadStatusLoadState:
        type: EnumAsStateSet

      ##
      # There are a few 'constants' that come from the table i don't need to track, so we drop them :)
      rPDULoadStatusBankNumber:
        ignore: true
        type: EnumAsInfo
      rPDULoadStatusIndex:
        ignore: true
        type: EnumAsInfo
      rPDULoadStatusPhaseNumber:
        ignore: true
        type: EnumAsInfo
The resulting snmp.yml is quite brief:
# WARNING: This file was auto-generated using snmp_exporter generator, manual changes will be lost.
apcups:
  walk:
  - 1.3.6.1.4.1.318.1.1.12.2.3.1
  get:
  - 1.3.6.1.2.1.1.3.0
  - 1.3.6.1.4.1.318.1.1.12.1.15.0
  - 1.3.6.1.4.1.318.1.1.12.1.16.0
  - 1.3.6.1.4.1.318.1.1.12.1.18.0
  metrics:
  - name: sysUpTime
    oid: 1.3.6.1.2.1.1.3
    type: gauge
    help: The time (in hundredths of a second) since the network management portion of the system was last re-initialized. - 1.3.6.1.2.1.1.3
  - name: rPDUIdentDeviceLinetoLineVoltage
    oid: 1.3.6.1.4.1.318.1.1.12.1.15
    type: gauge
    help: Getting/Setting this OID will return/set the Line to Line Voltage - 1.3.6.1.4.1.318.1.1.12.1.15
  - name: rPDUIdentDevicePowerWatts
    oid: 1.3.6.1.4.1.318.1.1.12.1.16
    type: gauge
    help: Getting this OID will return the Power in Watts. - 1.3.6.1.4.1.318.1.1.12.1.16
  - name: rPDUIdentDevicePowerVA
    oid: 1.3.6.1.4.1.318.1.1.12.1.18
    type: gauge
    help: Getting this OID will return the Power in VA. - 1.3.6.1.4.1.318.1.1.12.1.18
  - name: rPDULoadStatusLoad
    oid: 1.3.6.1.4.1.318.1.1.12.2.3.1.1.2
    type: gauge
    help: Getting this OID will return the phase/bank load measured in tenths of Amps. - 1.3.6.1.4.1.318.1.1.12.2.3.1.1.2
    indexes:
    - labelname: rPDULoadStatusIndex
      type: EnumAsInfo
  - name: rPDULoadStatusLoadState
    oid: 1.3.6.1.4.1.318.1.1.12.2.3.1.1.3
    type: EnumAsStateSet
    help: Getting this OID will return the phase/bank load state - 1.3.6.1.4.1.318.1.1.12.2.3.1.1.3
    indexes:
    - labelname: rPDULoadStatusIndex
      type: EnumAsInfo
    enum_values:
      1: phaseLoadNormal
      2: phaseLoadLow
      3: phaseLoadNearOverload
      4: phaseLoadOverload
  version: 2
The Dashboard
Once metrics are making their way into prometheus, it’s only a bit of work to get a dashboard up and running.
For sanity checking I fired up a load; a crypto-miner. See if you can spot when… :).

Simple dashboard in grafana
The json file for the dashboard is about 750 lines long, so rather than embed it, I’ve attached it as a file; the sha1 hash of dashboard.json is 400edb0c4064068f12e17c2f1f0d6862d3b8d449.
estimating costs
The dashboard just multiplies the average Wattage by the average cost of a kWh and then scales that to fit a 24h window.
The rate I pay for electricity changes based on the hour in which the power is used; about 40% of the week, my power costs a few cents per kWh more. The cost shown in the image above is a rough approximation based on my average power rate of around 12.5 cents per kWh. This rate can be adjusted with the avgkWH_Cost variable, if needed.
Files
-
files/dashboard.json:
sha1(dashboard.json): 400edb0c4064068f12e17c2f1f0d6862d3b8d449 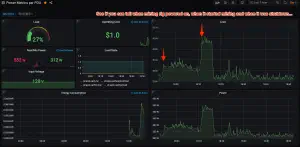
Simple dashboard in grafana

