Arris SB8200 Prometheus Exporter
This is a very short “announcement” post.
To beef up my home-lab observability stack, I’ve been working on a few projects to expose more data to Prometheus. Getting metrics from my cable modem has been on the “todo” list for literally years. There have been various metric exporters written in the past but they have either been archived/deleted off of GitHub or are otherwise inappropriate for my needs. So, I wrote my own.
The GitHub repo is here if you want to dive right in.
When set up, one possible way to visualize the data looks like this:
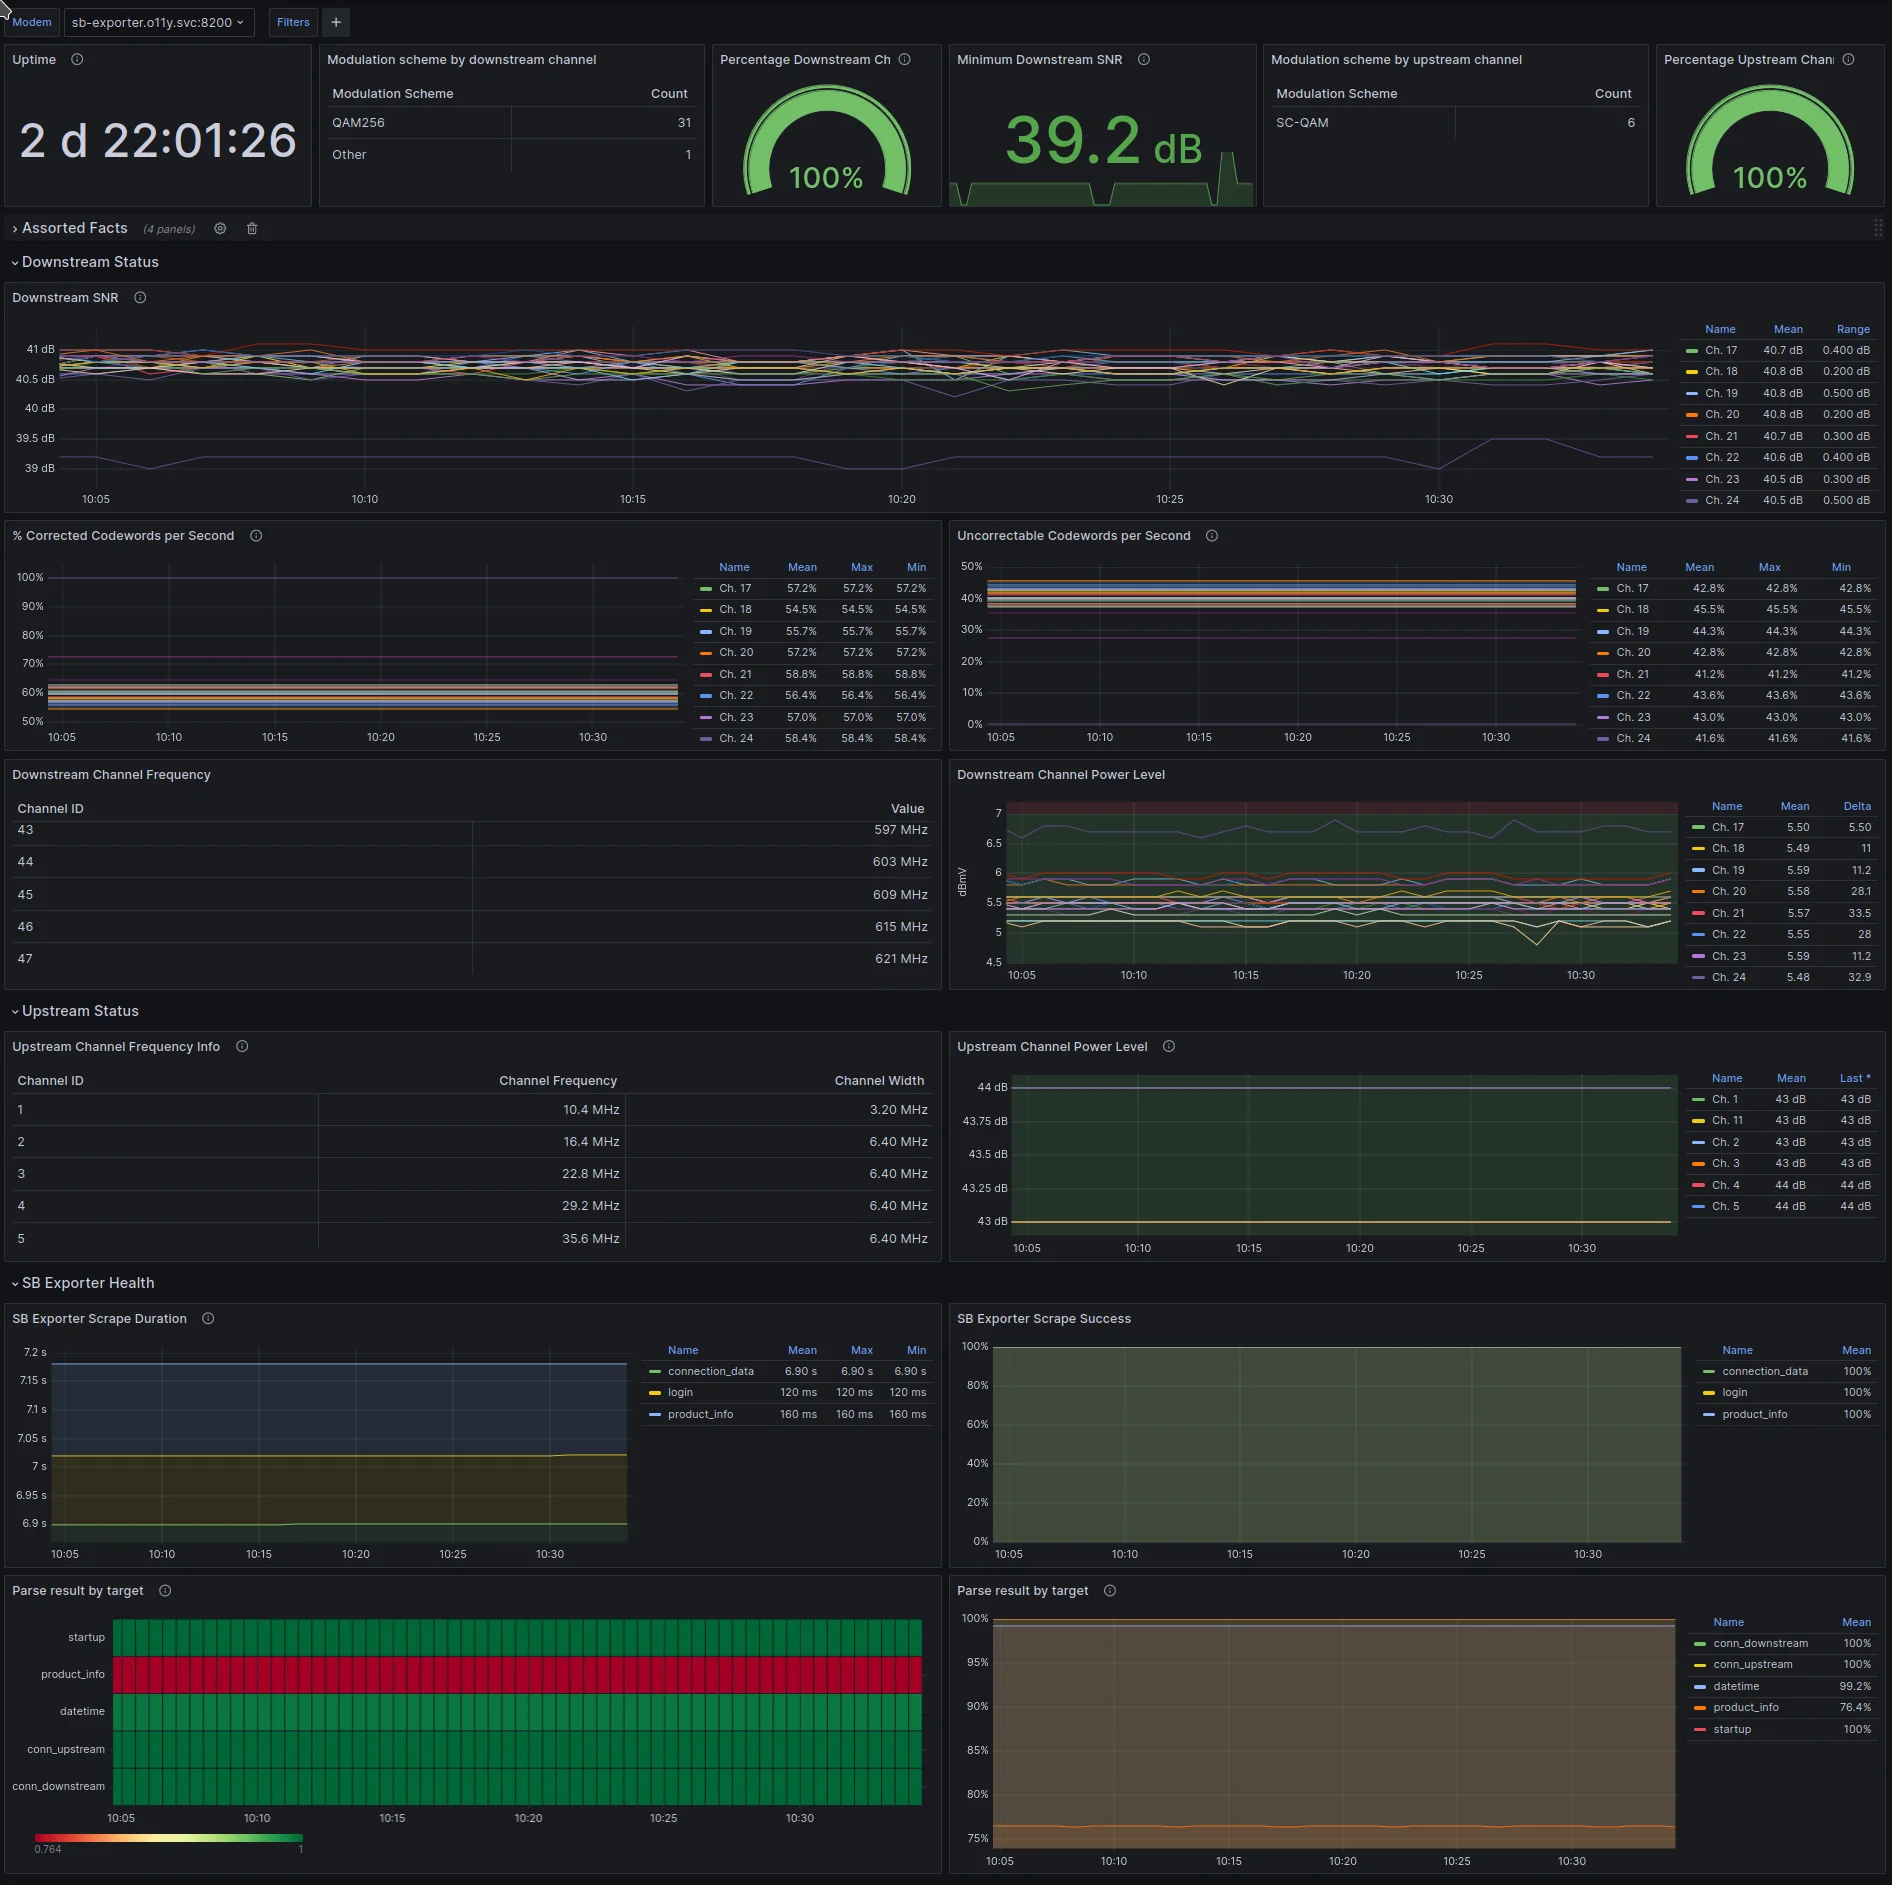
blah
A few observations
While building out the dashboard / prototyping it, a few things immediately stood out as “interesting”
After rebooting the modem, the metrics that keep track of error-corrected symbols sent/received over the connection are 0. This makes sense as the modem has just been rebooted and hasn’t had time to accumulate any errors yet. The first jump in correctable/uncorrectable errors… happens to corelate directly with a meaningful change in both received/downstream power and transmit/upstream power.
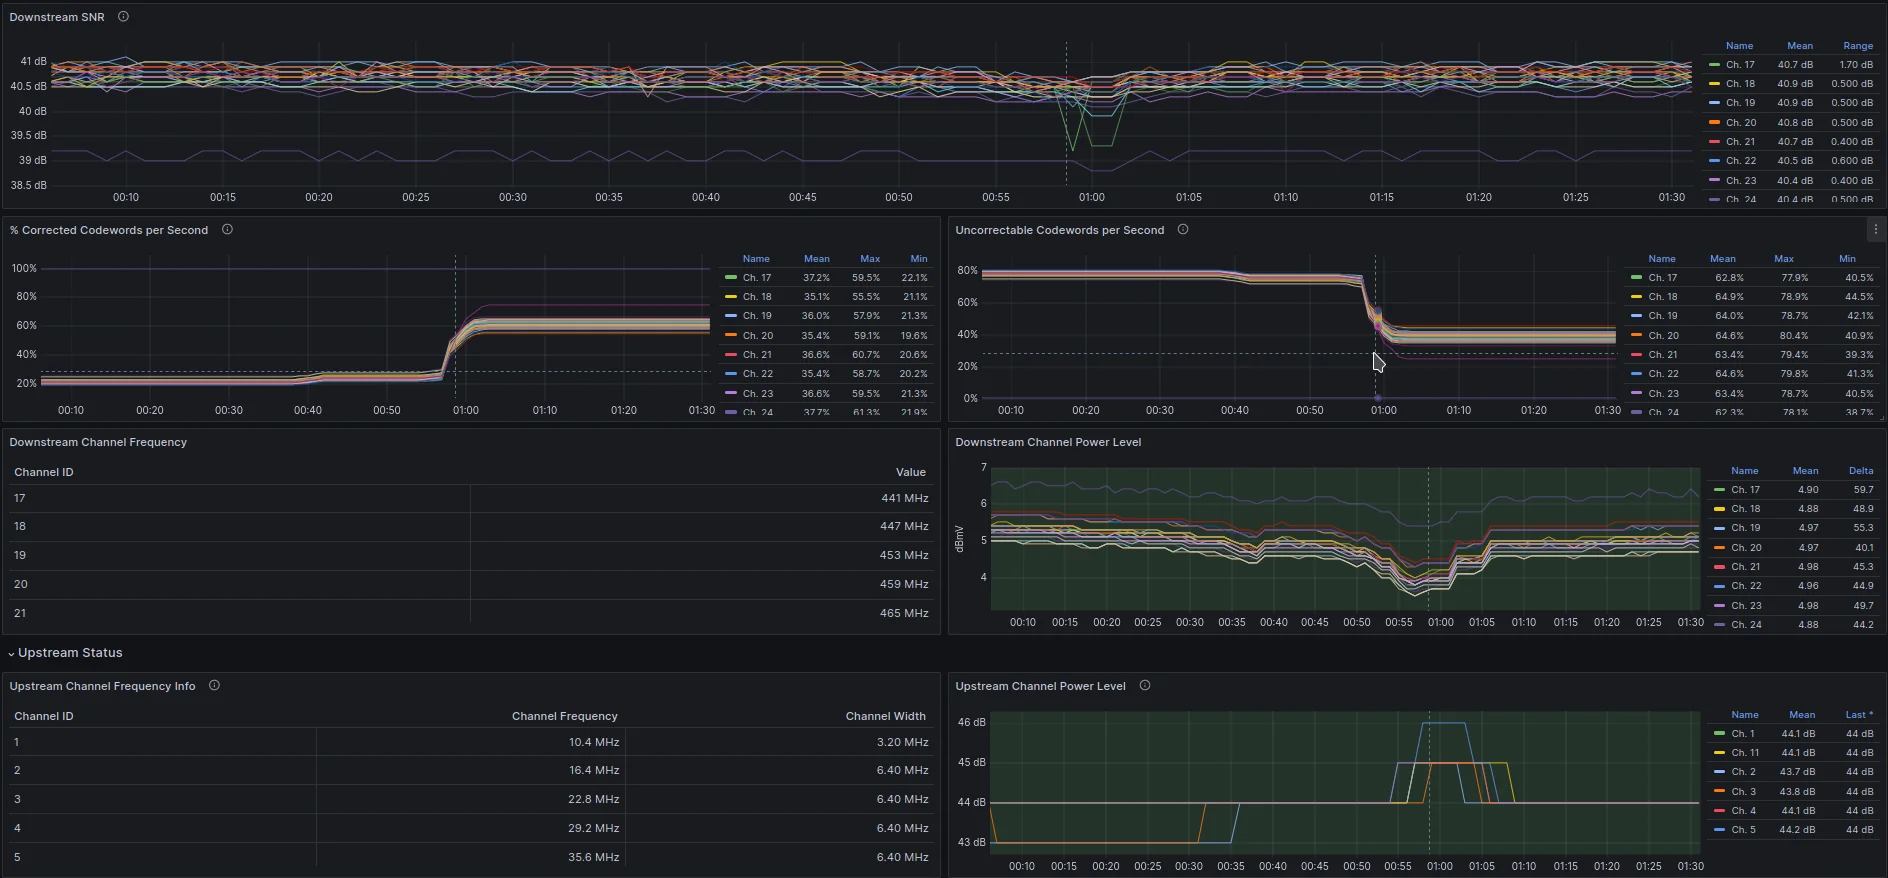
blah
The metric exporter keeps track of how long scraping the modem’s web interface takes as well as weather or not the scraped data was complete / well formed. The time it takes to scrape a particular endpoint increases pretty quickly after power up before leveling off. I’d love to know why the web server on the modem slows down so quickly after booting up….
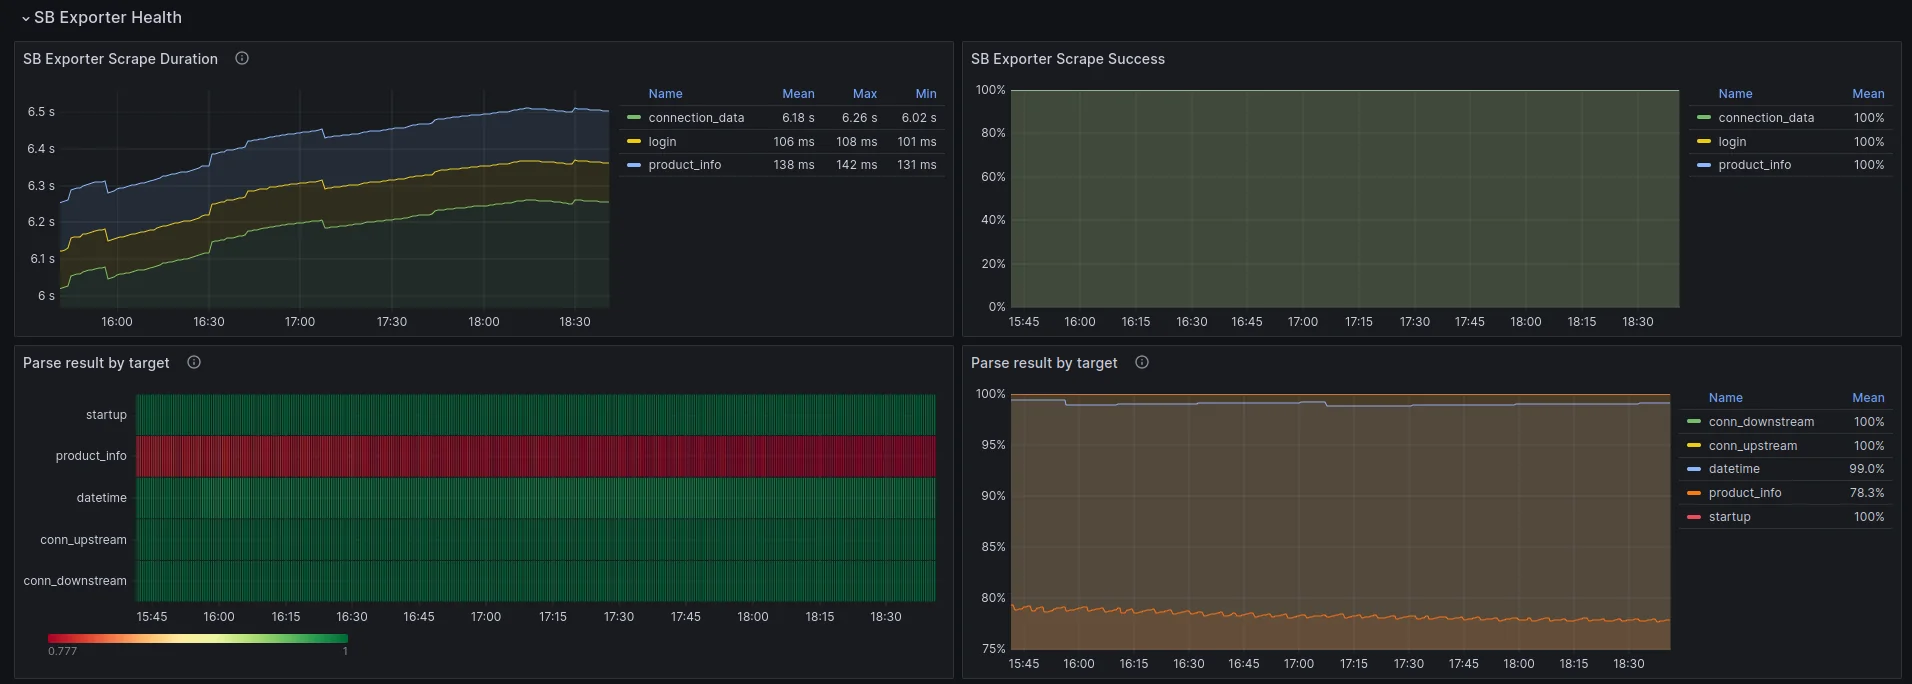
blah